Bitcoin's Price Recovery Hits a Wall Amid Nasdaq Weakness
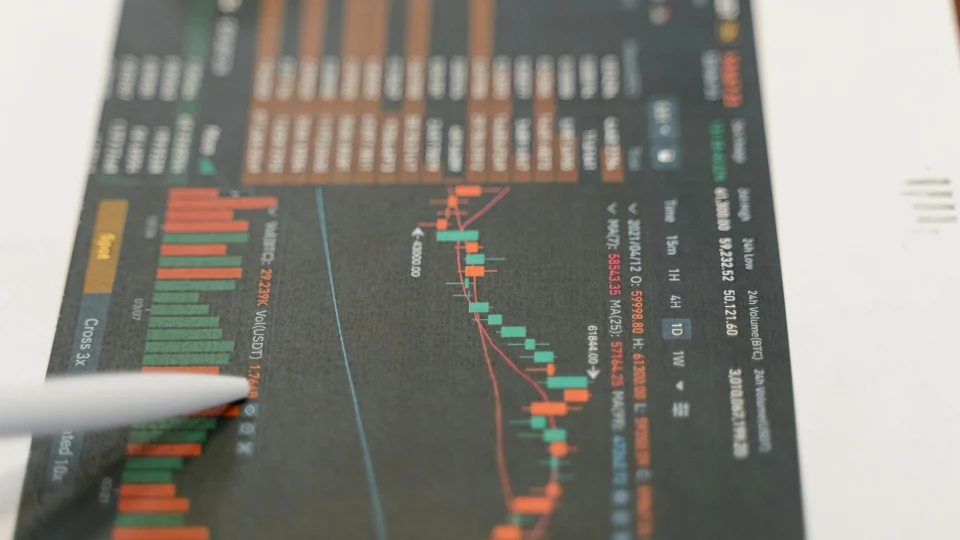
In the volatile world of cryptocurrency trading, a trader stares at dual screens displaying Bitcoin’s candlestick charts alongside the Nasdaq index. What starts as a promising uptrend suddenly falters, echoing broader market uncertainties that have long linked crypto movements to traditional finance indicators.
Bitcoin's Vulnerable Bounce and Market Signals
Bitcoin’s three-week price recovery, which pushed the cryptocurrency above $90,000 from lows near $80,000 on November 21, appears increasingly fragile. The asset carved higher lows and highs within a countertrend rising channel, but recent developments suggest a potential reversal. Despite a weakening U.S. dollar index following the Federal Reserve’s recent rate cut, Bitcoin failed to sustain momentum, retreating from $93,000 on Friday to around $88,000 by Sunday before stabilizing near $89,600.
- Bitcoin retreated from $93,000 to under $90,000 since Friday, despite dollar index weakness post-Fed rate cut.
- The recovery hinted at bullish shifts via longer-duration trend indicators, but lacked sustained rally power.
- Last week’s bearish candle showed a long upper wick, signaling rejection above $94,000 and fading bullish momentum.
This pattern underscores “sell-the-rallies” dominance at recent highs, raising concerns of a deeper drop toward the $80,000 support level.
Nasdaq's Influence and Bearish Indicators
The Nasdaq’s performance has long correlated with Bitcoin, particularly during downtrends where crypto often amplifies traditional market declines. Last week, the tech-heavy index dropped nearly 2%, forming a bearish engulfing candle that reversed prior gains. Coupled with a bearish MACD on the weekly timeframe, this points to potential downside volatility spilling into Bitcoin.
- Nasdaq’s bearish engulfing candle indicates potential downside volatility ahead.
- Strong positive correlation between Bitcoin and Nasdaq, especially in NDX downtrends.
- Bitcoin tends to move opposite the MOVE index, which measures 30-day implied volatility in U.S. Treasury notes.
The MOVE index recently formed an inverted hammer candle after a prolonged downtrend, suggesting early signs of bullish revival and renewed volatility in Treasuries. This could lead to financial tightening, capping gains in risk assets like Bitcoin.
Key Levels and Future Outlook
Analysts highlight critical support and resistance for Bitcoin. A breakdown from the counter-trend channel seems more likely than further upside, potentially re-testing $80,000 lows. On the bullish side, clearing $94,000-$95,000 could reclaim short-term momentum, though resistance looms from $96,000 to $100,000, including the 50-day SMA and Ichimoku cloud.
- Upside: Clearing $94,000-$95,000 needed for short-term bullishness.
- Resistance: Heavy levels from $96,000 to $100,000, including 50-day SMA and Ichimoku cloud.
- Downside risk: Potential re-test of $80,000 lows if channel breaks.
As Bitcoin navigates these technical signals intertwined with traditional markets, traders must weigh the implications of heightened volatility and correlation risks. What could sustained Nasdaq weakness mean for Bitcoin’s trajectory in the coming months, and how might evolving Treasury dynamics influence global risk appetite?